Open the compute metrics page for one of your jobs. There is a good chance you will see this picture.
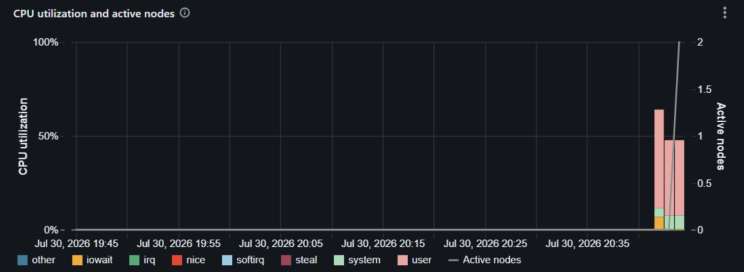
CPU stays between 20 and 50 percent. The number of nodes grows anyway. And you pay for every node: the cloud VM, plus the DBUs on top.
This story repeats in two versions. In one, a streaming job on a fixed-size cluster falls behind, so you add nodes by hand. In the other, a batch job on an autoscaling cluster asks for nodes on its own. Both times, you buy machines to clear a queue of waiting tasks. But CPU was never the thing that ran out.
What runs out is slots, not cores
Spark cuts work into tasks. By default, one running task takes one core. So a worker with 4 cores runs 4 tasks at the same time. These are the task slots. Read a Kafka topic with 8 partitions, and the connector creates 8 tasks: 4 run, 4 wait in a queue.
Here is the trap. A task keeps its slot even while it does nothing. A task that waits for Kafka, object storage, or a JDBC database still holds its core. The core is idle, but no other task can use it. To the scheduler, the cluster looks full. To the CPU chart, it looks empty. Both are telling the truth.
Small files create the same queue. Spark packs input files into partitions of up to 128 MB (spark.sql.files.maxPartitionBytes), but it also adds an opening cost for every file of 4 MB (spark.sql.files.openCostInBytes), and both settings apply to JSON. So a 12 KB file counts as 4 MB, and one partition holds at most 32 of them. Ten thousand small files become at least 313 tasks, and each task makes its own separate request to object storage.
Prove it before you change anything
Do not use iowait for this. Linux counts only blocking disk I/O there. Waiting on Kafka or S3 over the network is counted as plain idle time, so iowait will show near zero even when every task is waiting.
The real evidence is in the Spark UI. Open a stage and compare each task's duration with its CPU time. A long task with almost no CPU time is a task that spends its life waiting.
For a second proof, run the job with fewer machines, or a lower autoscaling maximum, and watch the CPU chart. If utilization does not rise to fill the gap, the cores were never the limit. The job may run slower during this test. That is fine: it is a test, not the fix.
The fix: more slots, not more nodes
SPARK_WORKER_CORES is the "total number of cores to allow Spark applications to use on the machine". By default it equals the real core count. On an rd-fleet.xlarge (4 cores, 32 GB) that is 4.
Setting it to 8 does not create new cores. It tells Spark to run 8 task threads at once on the 4 cores you have. Now, when a thread sits waiting for Kafka, another thread can use the idle core. In other words, all you really change is a name: 4 cores, now called 8. Databricks renames things all the time. This time, you do the renaming. No migration guide, no deprecation notice, just a cluster restart.
Set it under Advanced options -> Spark -> Environment variables and restart the cluster. Prefer Lakeflow Jobs compute over an interactive cluster while you are there.
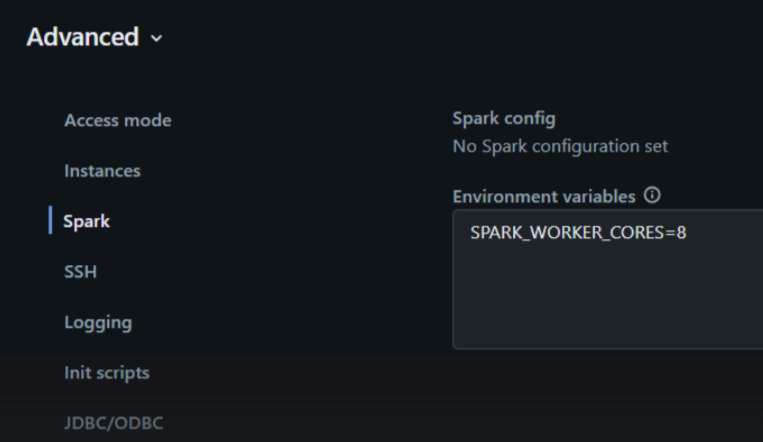
Two preconditions. First, the access mode: on standard compute, only a predefined list of environment variables reaches the Spark engine and init scripts, and SPARK_WORKER_CORES is not on that list, so on standard compute the variable never arrives. You need the dedicated flavor of Standard and Dedicated access modes. Second, the cluster shape: single-node clusters have no Worker process at all, see the last section.
Start with 6, about 1.5 times the cores. Run one full cycle of the job. Check utilization, task duration, and memory. If all three look healthy, move to 8.
Check that it worked
Open Spark UI -> Executors. The Cores column should read 8 on a 4-core machine.
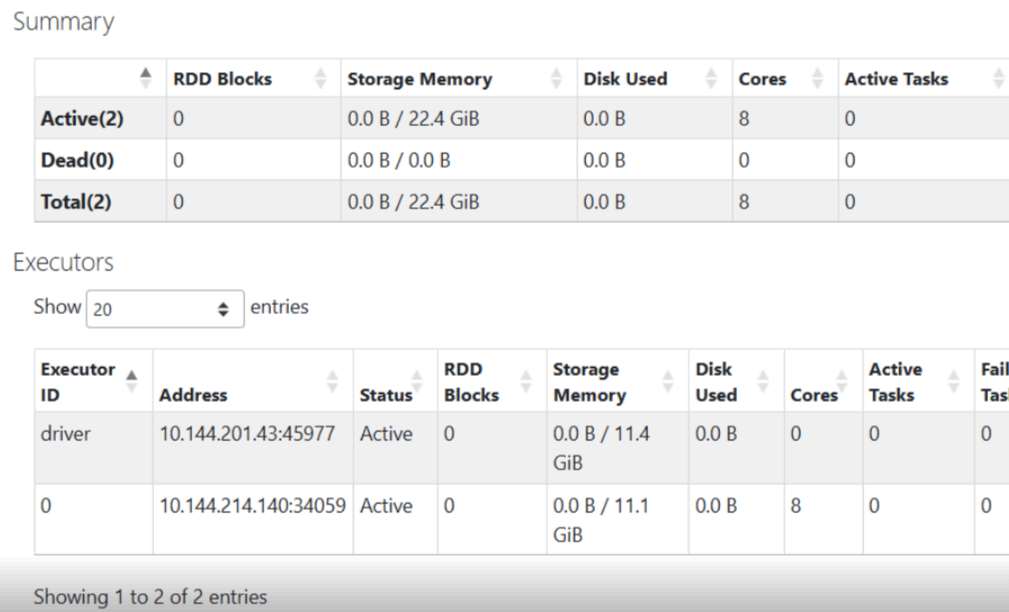
You get one 8-core executor only if spark.executor.cores is unset, which is the Databricks default. Set it to 4 and you get two 4-core executors instead: the same 8 slots, with the memory split differently.
What breaks first
Memory, not CPU. Eight tasks now share the heap that four tasks used to have. Expect more garbage collection, and watch for OutOfMemoryError, Full GC pauses, and disk spill. If they appear, lower the value, or move to a memory-optimized instance type.
| Your situation | What it looks like | What to change |
|---|---|---|
| More tasks than slots | A mostly idle cluster keeps adding nodes | SPARK_WORKER_CORES |
| More slots than partitions | Cores sit unused because no task is queued | minPartitions |
| Thousands of tiny files | Hundreds of short tasks, each opening one file | Compact the files |
| One task blocks a slot for a long time | The task really needs more than one core | spark.task.cpus |
The fraction that does not exist yet
The migration guide for the upcoming Spark 4.3 says that since Spark 4.3, spark.task.cpus accepts fractional values, and the Python TaskContext gains a cpuAmount() method that returns the possibly fractional amount. Until a Databricks Runtime ships that Spark version, the only lever for running more task threads than cores is still the undocumented one above.
Not on single-node clusters
A single-node cluster has no Worker process to configure. The "driver acts as both master and worker", running Spark locally and "spawns one executor thread per logical core in the compute resource, minus 1 core for the driver". Read that layout twice: the task threads share one machine with the driver, and the documented default already holds a core back for it. The equivalent knob would be the thread count in spark.master, and Databricks does not support overriding it on single node in the UI. And no, the 4 in local[*, 4] is not a core count: it is the number of allowed task failures.
What you actually save
This change does not lower any node's DBU rate. The saving is fewer nodes, or the same nodes running for less time. So it is only real if slots were the true limit. If your cores were genuinely busy, you gain nothing, and you pay for the attempt in memory pressure.
If you have tried this, I would like to hear two things: where you set your ceiling, and which metric told you to stop.